


Interactive mapping
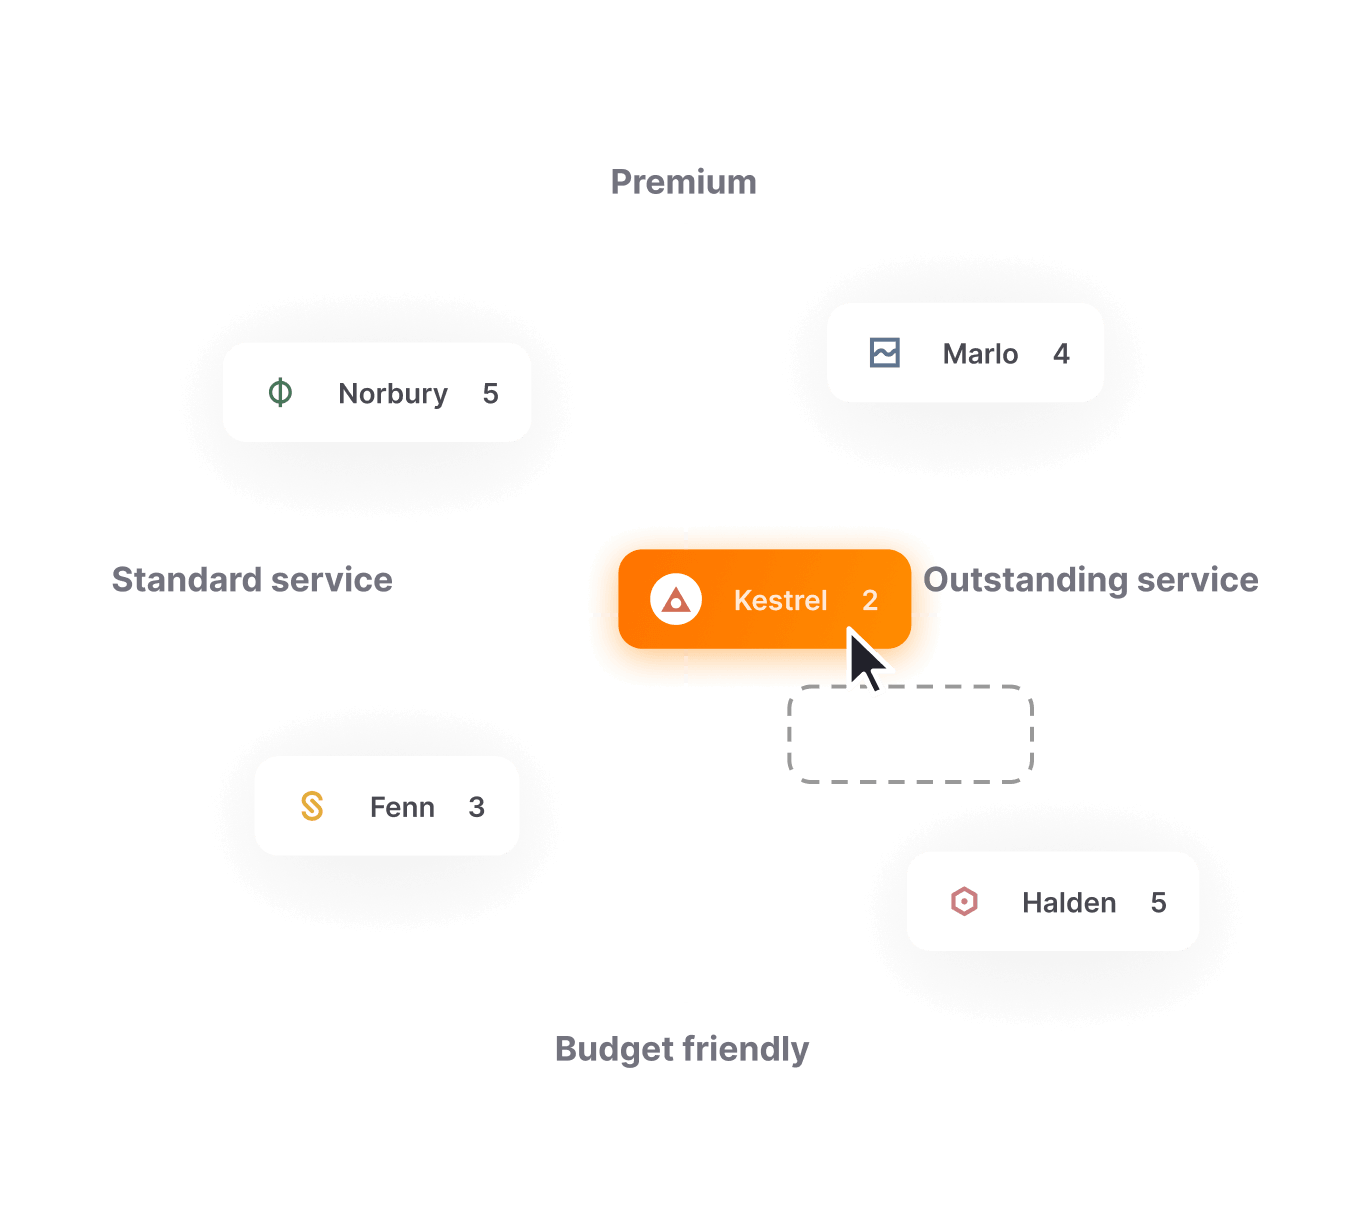
Set the map axes, preload brand or product images, or let participants upload their own content. The result is a dynamic, interactive mapping task that shows how they place brands and products relative to each other.
See how customers plot brands, products or any other image along an axis or template revealing implicit associations and comparisons
By placing brands, products or images on a map participants reveal emotional connections, and perceptual relationships that rational responses often mask.
Set the map axes, preload brand or product images, or let participants upload their own content. The result is a dynamic, interactive mapping task that shows how they place brands and products relative to each other.
An aggregated analysis dashboard provides an instant visual overview of brand or product positioning across the full group.
Features
All features are included at no additional cost. No limits on images, participants, or submissions.
01
Upload any template for participants to work from.
02
Specify images for participants to use, or allow them to source their own.
03
Control visibility of responses between participants.
04
Upload a range of images of brands, products or concepts for participants to select and place
05
Require written descriptions alongside each map.
06
See positioning and associations across the full group in a single view.
Use cases
Set axes representing key category dimensions and ask participants to map a competitive set against them. The aggregated dashboard reveals how your brand is positioned relative to competitors and where genuine white space exists in the market.
Run the same mapping task across different audience groups and compare outputs. Differences in how segments visually represent a brand or category often reveal more nuanced insight than demographics or claimed attitudes alone.
Use media maps or collages to define the visual and emotional territory for a campaign before development begins. The outputs give creative teams a consumer-grounded reference point that briefing documents rarely achieve.
Ask participants to plot early-stage concepts against two dimensions such as appeal and uniqueness, or relevance and believability. The aggregated dashboard quickly shows which ideas cluster in the “high potential” quadrant, so you can decide which ones to take forward to deeper evaluation.
Set axes representing key category dimensions and ask participants to map a competitive set against them. The aggregated dashboard reveals how your brand is positioned relative to competitors and where genuine white space exists in the market.
Run the same mapping task across different audience groups and compare outputs. Differences in how segments visually represent a brand or category often reveal more nuanced insight than demographics or claimed attitudes alone.
Use media maps or collages to define the visual and emotional territory for a campaign before development begins. The outputs give creative teams a consumer-grounded reference point that briefing documents rarely achieve.
Ask participants to plot early-stage concepts against two dimensions such as appeal and uniqueness, or relevance and believability. The aggregated dashboard quickly shows which ideas cluster in the “high potential” quadrant, so you can decide which ones to take forward to deeper evaluation.
Map a range of products against perceived price and perceived quality to see where your offer sits in the value landscape. This shows whether a premium positioning is credible, or where consumers feel a product is over- or under-priced compared with the competition.
Run the same mapping task before and after a campaign, rebrand or product launch and compare the aggregated outputs. Seeing a brand move on the map gives stakeholders a clear, visual measure of change that’s easier to grasp than tracking scores alone.
Run an identical map across several countries or regions to see how brand and category perceptions differ by market. Comparing the outputs side by side helps global teams decide where positioning can stay consistent and where it needs to adapt locally.
Map a range of products against perceived price and perceived quality to see where your offer sits in the value landscape. This shows whether a premium positioning is credible, or where consumers feel a product is over- or under-priced compared with the competition.
Run the same mapping task before and after a campaign, rebrand or product launch and compare the aggregated outputs. Seeing a brand move on the map gives stakeholders a clear, visual measure of change that’s easier to grasp than tracking scores alone.
Run an identical map across several countries or regions to see how brand and category perceptions differ by market. Comparing the outputs side by side helps global teams decide where positioning can stay consistent and where it needs to adapt locally.
Keep exploring
Book a demo and see how media maps, and the full platform, can work for your next project.


